
August 24, 2017
The “gap” is a dollar figure that seeks to measure a province’s aggregate net fiscal contribution or benefit vis-à-vis the rest of the federation. The federal government collects financial resources from its myriad revenue sources. It then allocates these resources to individuals, governments, institutions and corporations across the country, through an array of federal programs and transfers, to achieve various policy outcomes.

Wait, what?
It’s basically the difference between what Ontarians pay to the federal government in taxes, and what they get back in the form of services from the federal government.
Didn’t you just release a paper on this a few months ago?
Yes. In that report, we found that in 2014-15, Ontarians accounted for 38.9 per cent of the contributions to the federal treasury. But they received only 35.9 per cent of federal spending in return.
So what’s new?
This spring, Statistics Canada released an updated version of its Provincial and Territorial Economic Accounts data set. The release included updated estimates for federal revenue and expenditure by province, and extended the data set by a year. The additional year of data allows us to refresh our own calculations and to extend our analysis to 2015-16.
What has changed?
In 2015-16, the gap between the revenues Ontarians contributed to the federal government, and what they received in federal spending and transfers, was $11.8 billion. The recalculated number for the previous year (2014-15) was $9.2 billion.
In 2015-16, the gap between the revenues Ontarians contributed to the federal government, and what they received in federal spending and transfers, was $11.8 billion.
Wow, that’s a big change… isn’t it?
Yes and no. The gap has grown by $2.6 billion from 2014-15 to 2015-16. But Ontario’s underlying shares of federal revenue, spending and interest on debt have not changed substantially.
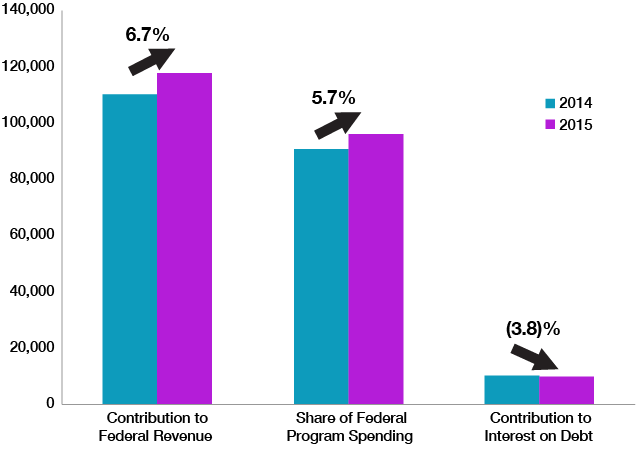
To demonstrate, let’s put that in percentage terms (see Figure 1). While the gap itself changed by 29 per cent, Ontarians’ contribution to federal revenue increased by 6.7 per cent ($7.2 billion). Federal spending in Ontario grew by 5.7 per cent ($5.2 billion). Ontarians’ contribution to federal interest on debt decreased by 3.8 per cent ($400 million).
Figure 1: Changes in Ontario’s Shares of Federal Revenue, Spending and Interest on Debt, 2014 to 2015 ($ millions)
What causes the gap?
Ontarians accounted for 39.2 per cent of federal revenues. This is slightly higher than, but more-or-less in line with Ontario’s share of the national population. That means Ontarians contributed slightly more than their per capita share to federal revenues (see Figure 2).
Figure 2: Ontario’s Share of Federal Revenue and Spending, 2015-16
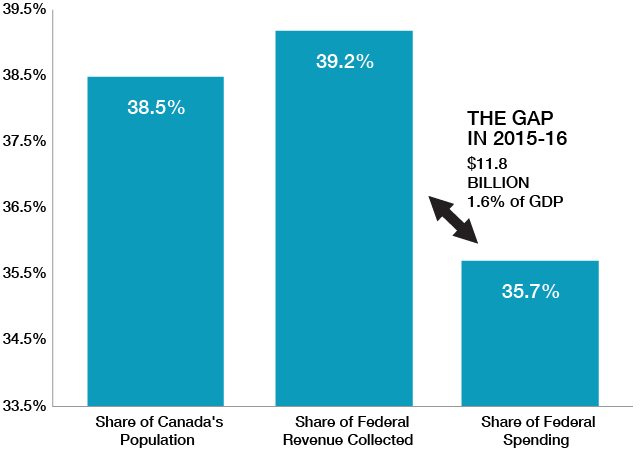
Most of the gap, however, can be attributed to the fact that only 35.7 per cent of federal spending occurs in Ontario. This is significantly lower than its share of the population.
Doesn’t that just boil down to Ontario getting less because it’s rich? Or is Ontario being singled out?
Much of the gap between Ontario’s population share and its share of federal spending does have to do with Ontarians’ incomes. In 2015, the median total income for all families in Ontario was above the national average. As such, a smaller proportion of Ontarians qualify for income supports intended for lower-income individuals, such as Old Age Security and Goods and Services Tax Credits. This is to be expected.
However, structural inequalities in the federation also persist. For example, Ontarians continue to receive a substantially lower share of Employment Insurance benefits (31.8 per cent in 2015) than either their share of the population or their share of Canada’s unemployed (an average of 37.7 per cent of the unemployed nation-wide in 2015). On a per capita basis, Ontario is also consistently well below the national average in terms of “other federal transfers to provinces” it receives (i.e. federal transfers excluding the Canada Health and Social Transfers and Equalization). This can deprive Canadians living in Ontario of comparable access to public services – violating the core principle of fairness.
Ontarians also made a net contribution of $4.4 billion to the Equalization program. That is, Ontarians funded 39 per cent, or $6.8 billion, of the program through their contributions to federal revenues in 2015-16. But Ontario received only $2.4 billion from the program.
I see, so Equalization is the problem then?
Let’s say yes and no again. The Equalization program has a very important redistributive function in Canada’s federal-provincial fiscal arrangements. A fundamental principle of Canadian citizenship is that all Canadians should have access to similar levels of public services, regardless of which province they live in. The federal Equalization program is Canada’s most important tool for ensuring this equity among provinces, given that provinces differ in their ability to generate revenues to pay for the services they are each responsible for providing.
In 2015-16 however, Ontario was once again the only province to have a fiscal gap of the kind described in this note and receive Equalization simultaneously. This highlights a disconnect between the measurement of fiscal capacity in the Equalization program and the overall net contribution that Ontarians make to the federation.
So you’re saying there’s no problem with Equalization?
No, we wouldn’t go that far. The program has plenty of issues, such as unpredictability for provinces, unequalized fiscal capacity, and reliance on unreliable data. Furthermore, it does not take into account differences in spending needs across the provinces.
OK, back to the gap. Put this in context for me. How big is this problem? Why should I care?
A net fiscal contribution to, or benefit from, the federation is not inherently wrong. Quite the opposite, in fact. Redistribution is a natural and desirable aspect of federalism and is to be expected.
However, the $11.8 billion flowing out of the province equals 1.6 per cent of its GDP. This represents a real opportunity cost. To provide but one example, $11.8 billion was more than the entire Ontario Ministry of Community and Social Services budget for that year. When large sums of public dollars are redirected elsewhere and done so without transparent justification, this can erode the ability of the provincial government to provide important goods and services to its public.
Is Ontario the only net contributor?
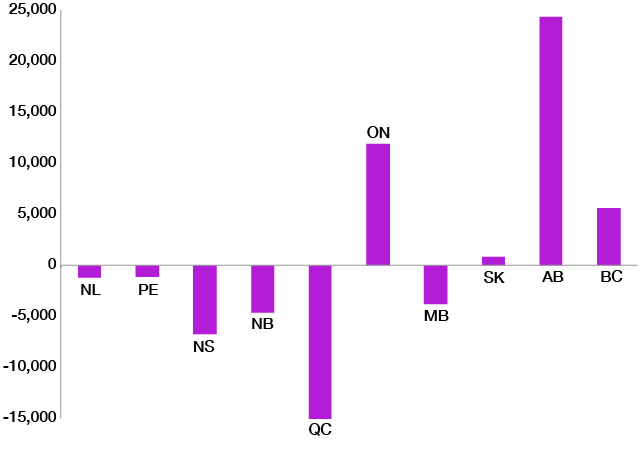
No. Alberta, British Columbia and Saskatchewan are also net contributors (see Figure 3) and have been since at least 2009-10.
Figure 3: Net Contribution/ Benefit by Province, 2015-16 ($ millions)
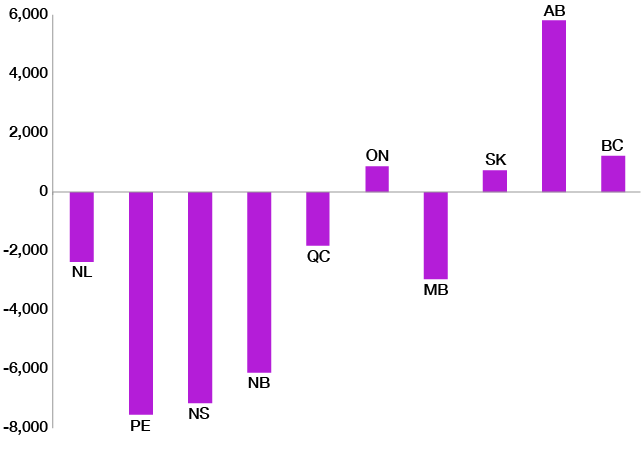
The relative size of Albertans’ net contribution is put into particularly stark relief when compared to the rest of the country on a per capita basis (see Figure 4).
Figure 4: Net Contribution/Benefit by Province, 2015-16 ($ per capita)
What does the future hold? Please, make some predictions.
We expect that Statistics Canada will release updated Provincial and Territorial Economic Accounts figures next spring. We will be able to refresh our calculations once again at that point.
Have you run out of clever gap-related titles?
It would appear that way, wouldn’t it?
What if I want more information on the gap and your methodology?
Our January 2017 report Mind the Gap goes into some detail on the history of Ontario’s fiscal gap, including time-series data. Information on how we arrive at our calculations is available in the appendix to that report.
Authors
Erich Hartmann
Jordann Thirgood
Release Date
August 24, 2017


